Comparable Grading From Observational Data
Many-Facet Modeling with Soft Anchors
NHH, 25 September 2026
My job is generally nice, but…
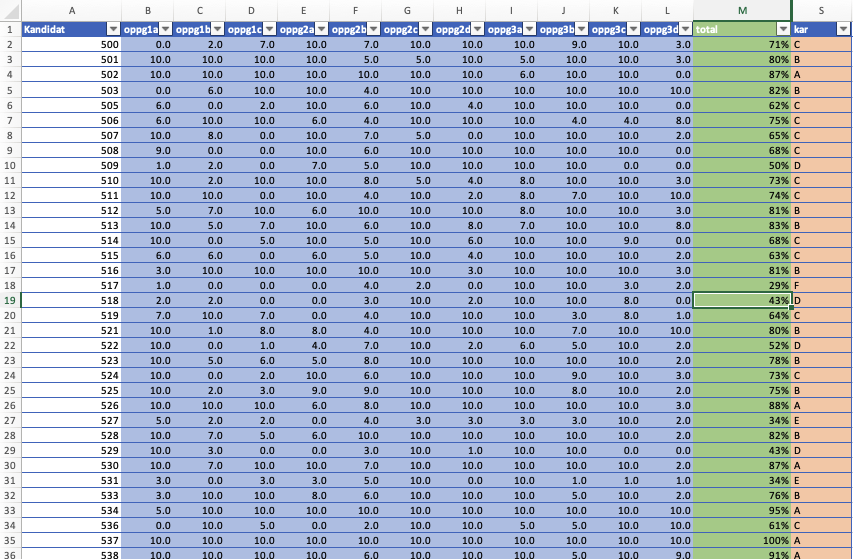
A procedure for grading in quantitative courses
- We create an exam having a certain number of questions.
- Each candidate’s answers are assigned to a grader.
- Each question is scored from 0 to 10, giving a total percentage score from 0–100.
- A grade on the A–F scale is assigned from cut-off points.
Two issues return every single time:
- Should we adjust grading for question difficulty? If so, how?
- Should we adjust grading for varying grader severity? If so, how?
The question
Can we recover a stable way to estimate student ability after correcting for difficulty and assessor severity, that is comparable across cohorts?
This is an interesting research question in its own right, but here presented as an example of doing research on my own teaching.
A measurement problem with a long history
Separating ability from difficulty and severity is exactly what Item Response Theory has studied for decades. The general problem is to measure latent traits: How well do individuals in a group like chocolate?, or in this case: To which degree do the students in a cohort achieve the learning outcomes in my course?.
Two subfields are directly relevant:
- Linking / test equating — comparing results across different tests, usually through common (“anchor”) items.
- Multi-facet Rasch models — modelling assessor severity, drift over time, and their interactions.
My twist: the data are fully observational. There is no cross-grading, only partial assessor overlap and repeated question types. A common scale has to be recovered from those two things alone.
My data: nine cohorts of MET4
- 9 cohorts of MET4, a mandatory applied-statistics course.
- 11–13 free-response questions per cohort, each scored 0–10 by a single assessor.
- Scores recoded to an ordered 0–3 scale: \[\{0,1,2\}\to 0,\quad \{3,4,5\}\to 1,\quad \{6,7,8\}\to 2,\quad \{9,10\}\to 3\]
- 8 assessors in total (2–4 per cohort); 13 recurring (“linked”) question types.
- 2,075 candidates (≈230 per cohort); 25,555 item responses.
- Cohort mean scores range from 1.67 to 2.17 on the 0–3 scale.
The model
- Ordered score \(Y_{ijca}\in\{0,1,2,3\}\) for candidate \(i\), item \(j\), cohort \(c\), assessor \(a\).
- Cumulative-logit (proportional-odds) model with shared thresholds \(\tau_1<\tau_2<\tau_3\): \[P(Y_{ijca}\le k\mid\eta_{ijca})=\operatorname{logit}^{-1}(\tau_k-\eta_{ijca}),\qquad k=1,2,3.\]
- The linear predictor splits the score into facets: \[\eta_{ijca}=\underbrace{\mu_c}_{\text{cohort}}+\underbrace{u_i}_{\text{ability}}-\underbrace{\beta_j}_{\text{item}}-\underbrace{\alpha_a}_{\text{assessor}}-\underbrace{\delta_{ac}}_{\text{drift}}-\underbrace{\kappa_{a\ell(j)}}_{\text{assessor}\times\text{content}}-\underbrace{\gamma_{c\ell(j)}}_{\text{item drift}}\]
- Student ability is \(\theta_i=\mu_{c(i)}+u_i\), with \(u_i\sim N(0,1)\) anchoring the scale.
- The hard part is the recurring question types (the “linked” items).
- Hard linking assumes a linked type is equally difficult every year (\(\gamma_{c\ell(j)} \equiv 0\)). This hypothesis is clearly rejected by the data.
- Soft linking (\(\gamma_{c\ell}\)): linked items share a baseline difficulty but may drift cohort by cohort, with the drift regularised toward zero unless the data insist. This improves out-of-sample predictive performance dramatically.
Item difficulty on a common scale
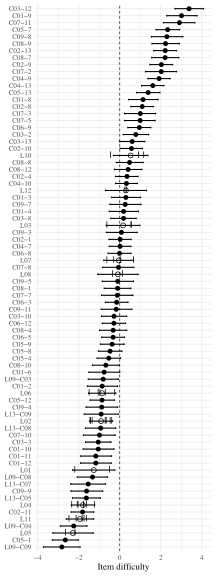
- Estimated difficulties span roughly 6 logit units.
- Open circles are a linked type’s shared baseline; the ticks are its cohort-specific difficulties.
- Several linked types drift noticeably — the same task type was not equally hard every year. That is exactly what soft anchors absorb.
Assessor severity — modest in aggregate
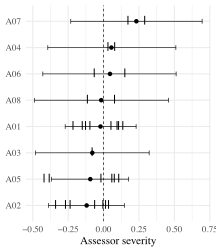
- Baseline severities span only about a third of a logit unit.
- The 95% intervals are wide and mostly overlap zero.
- The assessor effects appear modest in aggregate
Keep this in mind for later.
A counterfactual experiment
- Hold the historical A–F proportions fixed, but re-rank students by estimated ability \(\widehat\theta_i\). How much would grades move?
| Cohort | Down (%) | Same (%) | Up (%) |
|---|---|---|---|
| C01 | 50.0 | 50.0 | 0.0 |
| C02 | 0.0 | 56.5 | 43.5 |
| C03 | 7.6 | 79.2 | 13.2 |
| C04 | 17.3 | 77.2 | 5.5 |
| C05 | 41.1 | 57.1 | 1.7 |
| C06 | 17.1 | 77.9 | 5.1 |
| C07 | 5.0 | 80.5 | 14.5 |
| C08 | 7.5 | 69.0 | 23.5 |
| C09 | 20.0 | 71.1 | 8.9 |
Some cohorts barely move; others move a lot — C01 and C05 (easy sets, lenient marking) send ~40–50% down, C02 and C08 send 24–44% up.
What drives the movement?
An ordered-logit model of the direction of movement (Down < Same < Up), with two standardised student-level predictors:
| Term | Estimate | Std. Error | OR | OR 95% CI | \(p\) |
|---|---|---|---|---|---|
| Ability | 0.258 | 0.053 | 1.294 | [1.17, 1.44] | <0.001 |
| Assessor severity deviation | 0.473 | 0.051 | 1.605 | [1.45, 1.77] | <0.001 |
The assessor severity deviation is the largest effect — larger than ability itself. (Item difficulty is common to everyone in a cohort, so it is absorbed by the cohort intercept.)
Takeaways
- With a many-facet model and soft anchors, we can put students from different cohorts on a comparable ability scale — from purely observational grading data.
- Doing so exposes how much of a raw grade reflects the exam conditions a student happened to face.
- For our own teaching: aggregate fairness checks can look reassuring while individual grades are still moved by who did the scoring.
- Interesting parallel to the current debate on national school tests where the government proposes to remove the anchors in order to stop ranking schools and neighbourhoods.
- Can researchers still recover a common scale via soft anchors?